Interactions with Data Visualisations
|
It can be difficult for people to understand the meaning of data. Presenting data to the public in an appropriate way may also increase citizen’s willingness to participate in data collection. This study explores how large screens can support data exploration. This research project is part of a wider open government initiative, which aims to create computational models to help predict and reduce the spread of diseases and understand how contiguous phenomena are linked to mobility and human behaviour.
Research type:
My role:
Team: Lars Lischke, Lancaster University, Institute for Visualization and Interactive Systems Paweł W. Wozniak, Institute for Visualization and Interactive Systems |
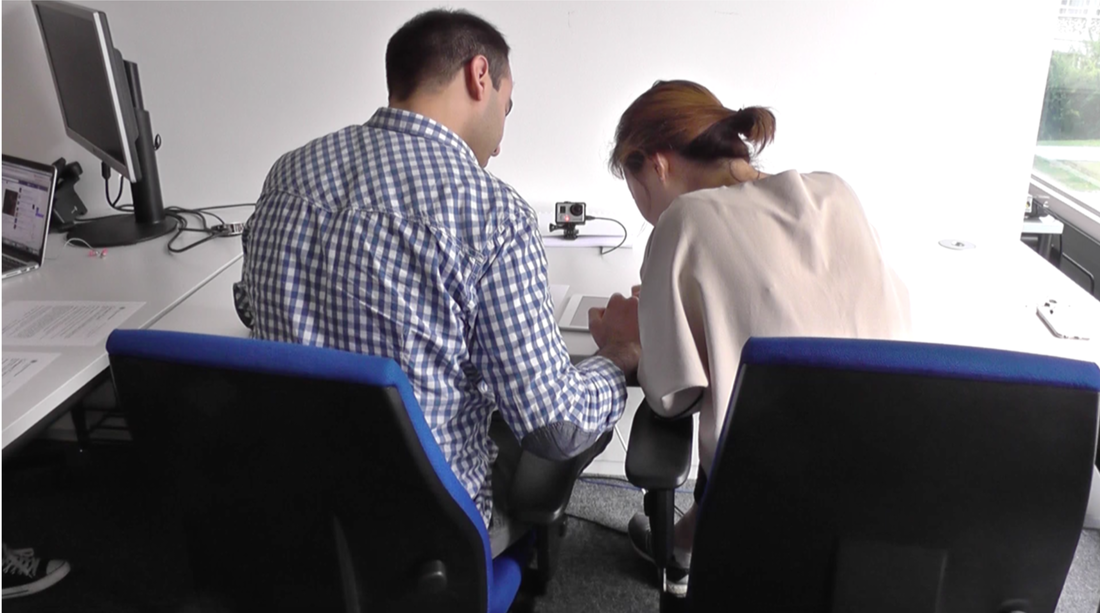
Participants interacting with visualisations in the LHRD condition.
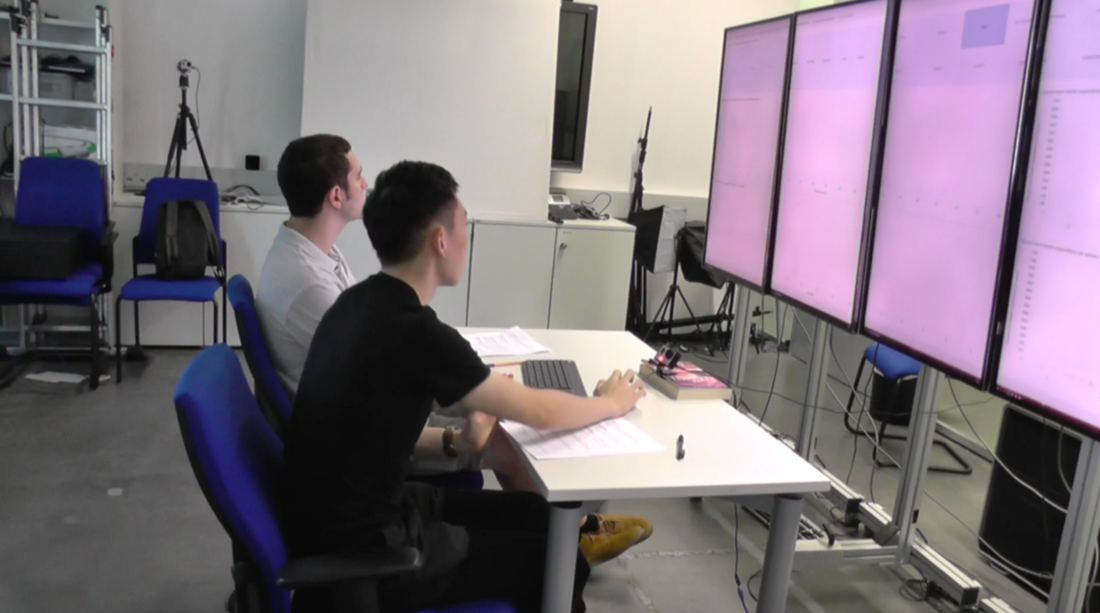
Participants interacting with visualisations in the iPad condition.
|
|
Problem
Data is pivotal to open government initiatives, where citizens are often expected to be informed and actively participate. Yet, it can be difficult for people to understand the meaning of data. |
Opportunity
Current technology offers a range of solutions, which can help spread information and facilitate understanding. Data visualisation software is becoming increasingly more accessible and interactive. Furthermore, the technology that can be used to present visualised data now ranges from a smartphone to large displays many meters across. |
Research aims
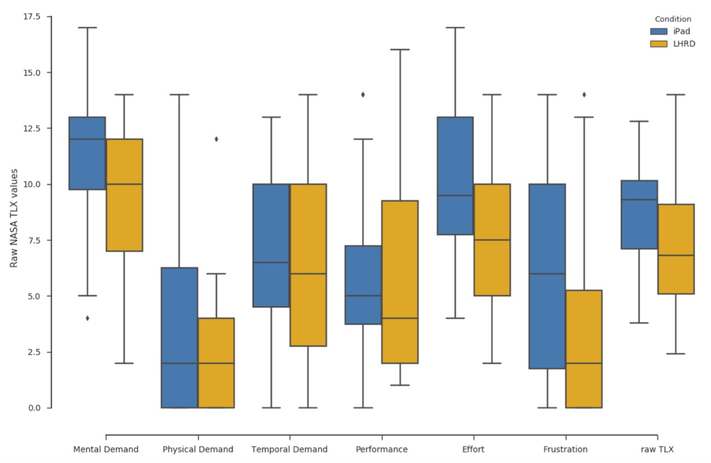
This study explores how large screens can support socially relevant data exploration. In a between subject laboratory experiment, we analysed how pairs of participants explored data visualisations on a high-resolution display (LHRD) and a tablet. |
Lessons learned
While large displays were perceived as less mentally demanding than tablets within the same set of data exploration tasks on Spotfire, tablets lead to more turn taking and shared control of the interface. The participants in both scenarios felt more comfortable with sharing their own data with us after the study. |